Home / Risk assessment / Stage 3
Stage 3 - Risk Analysis
The risk analysis follows a sequential approach in estimating the risk:
- Estimating the likelihood of potential accidental events
- Estimating the potential severity of the consequences in case of event occurrence
- Combining likelihood and consequence in a risk metric
In the following, the Guideline distinguishes between two categories of risk analysis. These are:
A) Ship traffic risk
B) Environmental risk assessment
The two categories of risk analysis are often conducted in sequence; first A to estimate the likelihood of marine accidents and loss potential (e.g. oil spill amount) and then B to assess the potential impact to the environment (e.g. sensitive and vulnerable areas, and wildlife).
Ship traffic risk
Ship traffic risk analysis aims to estimate the likelihood of ship accidents in a given waterway or sea area, and the potential consequences in terms of fatality risk and/or spill risk. The analysis often uses the current ship traffic conditions, as well as likely future scenarios involving changes in traffic volume or fleet composition, changes in routes, or changes in the applied Aids to Navigation (AtoN), etc.
It is recommended that the risk analysis calculates likelihood of occurrence for the following types of marine accidents:
- Ship grounding
- Ship-ship collision
- Contact/allision with fixed objects (if relevant)
- Ice-related accidents (contact with ice, etc).
- Foundering
- Fire/explosion
Accident types of operational character, e.g. bunkering, fuel/cargo transfer, etc. is not part of this Guideline.
Output (frequency of accidents)
It is recommended that the likelihood of events is expressed in terms of annual frequencies, and separated according to relevant categories of ship types, ship sizes (tonnage and/or length), season, geographical areas, as found relevant.
Further, consequences of potential events must be modelled, e.g. taking into consideration of probability of oil spill, expected spill volumes for different categories of ships. Finally, likelihood of events and consequences should be combined in a risk metric.
Output (frequency of fatalities and/or oil spills)
Example risk expressions are listed below:
- Frequency of accidents with oil spill (and sorted on different types of oil)
- Frequency of accidents with fatalities
- Average spill of oil per year (measured in tonn per year)
- Average fatalities per year (measured in number of fatalities per year)
Best practice quantitative risk calculation methods incorporate the following elements:
- High resolution AIS data; for increased traffic image accuracy.
- Full year, preferably multi-year AIS data; to capture seasonal traffic variations.
- Enriched AIS data with ship specific data; for detailed ship characteristics (type, length, size, number of crew and passengers, fuel and cargo capacity, etc.).
- Up-to-date causal data and accident statistics; to derive probabilities of accidents, fatalities and oil spills.
- Grid system; preferably scaled down to 10x10km or 1x1km, to calculate and present risk.
- Geographic data; for coastal and hydrographic/bathymetric data.
- Quantification of relevant ARIFs; to include relevant factors which may impact on the risk level.
Applying the elements above will ensure risk assessments are more harmonized in terms of their inputs and outputs. Tools and methods which apply many of these elements are; (listed in alphabetic order);
AISyRisk The AISyRisk model comprises novel high-resolution AIS-data-based approaches for calculating grounding and collision accident frequencies. Additionally, existing models for fire, explosions, and foundering accidents have been adapted for use with AIS data input. The model outputs in grid system; accident frequencies, spill frequencies, loss of life and oil spill frequencies. Earlier version of the methodology in AISyRisk has been applied in Barents Sea, North Sea and waters around Svalbard and Greenland. The model is developed by the Norwegian Coastal Administration and DNV GL.
Links:
Barents Observer Article: Future Governance of Environmental RiskDNV GL arcticle: New insights show the value of open ocean data
Be-Aware
Area‐wide risk assessment model; focus on oil spills and hazardous liquid substances from shipping accidents or from other offshore activities. The methodological principles are taken from the methodology of the BRISK project (BRISK, 2012) and adjusted to the specific conditions of the North Sea area. The model has been applied in the Greater North Sea and its wider approaches, as part of the co-financed EU project BE‐AWARE.
Links:
Be-Aware Summary ReportIWRAP - IALA Waterway Risk Assessment Programme
The IWRAP MK II tool is based on a model for calculating the collision and grounding frequency on a specific route. This model involves a so-called causation probability, which is multiplied with a theoretically obtained number of grounding and collision candidates. IWRAP has been applied in many local risk assessments of specific fairways. IWRAP is limited to grounding, collision and contact accidents. IWRAP is developed by IALA and Project 44.
Links:
IWRAP MK2 IntroductionMarinRisk: The MarinRisk tool can be used to estimate the total expected number of accidents, oil spills and associate costs, for each ship for each area for which AIS data is available, by using a risk index. The model use a Nautical Risk Index to determine the contribution of the total risk of individual vessels. Also, when all risk numbers are aggregated for a certain area, the total risk value of that area (grid system) can be determined. The general risk modelling is based on the ideas of SAMSON (Safety Assessment Model for Shipping and Offshore on the North Sea). The model is under development by Maritime Research Institute Netherlands (MARIN).
SAMSON - Safety Assessment Mode for Shipping and Offshore in the North Sea
The Model calculates the frequency, volume, location and oil type of a potential ship-source oil spill within each grid cell. The model has been applied in “Transport Canada Area Risk Assessment Methodology Development for Ship-Source Oil Spills in Canadian Waters”. The model is developed by Maritime Research Institute Netherlands (MARIN).
Links:
Area Risk Assessment methodology for ship-source spills in Canadian waters.OpenRisk Guideline
A comprehensive review of all available methods and tools are provided in OpenRisk Guideline for Regional Risk Management to Improve European Pollution Preparedness and Response at Sea.
The list below presents best practice models on including ARIFs. Elements and principles of these models and methods can be used in Marine Risk assessments.
The quantitative Risk model use a Safety and Operability Index (SOI), giving a rating to risk factors relevant to Arctic operation. Arctic elements in the SOI include: Open water season, ice coverage, ceiling, visibility, SAR, temperature, days below -20, daylight, wind speed, marine icing and wind chill index.
The safety and operability index reflect when work outdoors can be performed safely, and under which circumstances it must be avoided. The index is rooted in the NORSOK standard S-002 on Arctic working environment.
Arctic Shipping Risk model
Arctic Shipping Risk model is a quantitative route-based ship traffic risk model. It has been applied on two cases for Arctic shipping; cruise-ship activities in ice-infested waters and use of the NSR for transit shipping. It includes the following arctic elements:
- Canadian Arctic ice Regime Shipping System (AIRSS) to evaluate ice conditions.
- Inclusion of Arctic accident; hull ice impact, collision in ice and grounding in ice.
- Visibility adjustment for relevant accident scenarios.
- Daylight adjustment for relevant accident scenarios.
- Water temperature adjustment of expected number of fatalities.
- Frequency adjustment due to convoy operation
HFO in the Arctic – Risk Model
This study was carried out on behalf of PAME. It identifies the risks associated with the use and carriage by ships of HFO in the Arctic. It includes the following arctic elements:
- Frequency of ice related accidents, by using sea-ice coverage data for each cell combined with incident statistics.
It includes the following arctic elements:
- Frequency of ice related accidents, by using ice coverage data for each cell has combined with incident statistics.
- Environmental sensitivity.
POLARIS provides a risk assessment framework to assess navigational safety in a given ice regime, using observed or historical ice conditions and concentration and a polar ship classification.
IMO (2016): GUIDANCE ON METHODOLOGIES FOR ASSESSING OPERATIONAL CAPABILITIESIMO/IACS (2014): POLARIS – proposed system for determining operational limitations in iceEnvironmental risk and sensitivity
The environmental risk part of the marine risk assessment builds upon the ship risk assessment and quantified probabilities for spill of various hazardous substances. The approach is to assess the potential ecological and sometimes socio-economic consequences of such spills by considering the sensitivity of different types of environments to spill-related damage.
The approach includes mapping of sensitive areas and periods and a vulnerability assessment towards the different spill types. Sometimes, the approach includes spill modelling in order to account for the fate and trajectory of the spill.
The EPPR screening study shows that few of the environmental risk methods and approaches considered specific factors for arctic environments directly, the arctic elements are more often reflected indirectly in the data and datasets used to determine vulnerability and consequence potential.
A short overview of the most relevant best practises for marine environmental risk assessment are given below:
NOAA. RPS ASA, Env Research Cons., RPI, Louis Berger Group (2014) including a Spill Risk Calculator tool. Assessment intended to identify broad regions and seasons within Alaska having both high relative environmental vulnerability and high relative oil spill probabilities and spill volumes. The report also includes a Literature review of methods for vulnerability and risk assessments. The method has included ice as a separate habitat in the vulnerability assessment.
Norwegian Coastal Administration. DNV GL (2014). In Norwegian. This approach was followed up in the Greenland assessment below.
Defence Command Denmark. DNV GL (2015). The risk assessment was intended to quantify the likelihood of marine accidents with and without pollution by spill of oil products, oil/chemical cargo products and fuels, as well as corresponding spill volumes and environmental risk. Risk calculations performed on resource groups seabirds, marine mammals, shoreline and fish.
Transport Canada. WSP / SL Ross (2014). The methodology was developed to best represent and compare the relative risk of pollution from ship-source spills of oil products and select HNS transported in bulk in Canadian arctic waters (18 sub-sectors). The assessment includes ice as shoreline type and made some adjustment of the Human-use index to arctic conditions (incl. Coastal Population Index).
Transport Canada. Dillon, MARIN, RPS ASA, Royal Haskonig DHV (2017). Objective of this assessment was to produce a consistent methodology be used to assess the risks posed by ship-source oil spills in Canadian Waters. In addition to determine the most vulnerable areas within Canadian Waters to a ship-source oil spill (south of 60th Parallel). The method includes stochastic oil spill modelling to calculate prob. of exposure for selected spill scenarios.
HELCOM 2009-2012
BE-AWARE had the objective to identify the most effective risk reducing (RRM) and response measures (RM) for the five project sub-regions in the greater North-sea based upon: the risk and size of oil spills calculated in the BE-AWARE I project, modelling of the outflow of oil from those spills, an environmental and socioeconomic sensitivity analysis and a combined impact assessment. Includes a comprehensive vulnerability assessment (not Arctic specific) of sensitive features and socio-economic features.
Some arctic considerations towards elements in the environmental risk assessment are given below:
None of the methods for marine risk assessment in arctic waters have applied oil spill modelling in ice, although such short-duration modelling is feasible with existing oil spill models.
For regional assessments that want to support more site-specific consequence maps (grid cell level), modelling of spill trajectory and fate can be performed for open-sea areas or areas with lower ice concentrations. A simplified approach can be followed by applying a look-up spill radius for each oil type and volume category (see Greenland assessment) or more detailed as Strategic modelling in homogenous areas.
Links:
Marine Environmental Risk Assessment GreenlandBe-Aware Summary ReportFor site-specific risk assessments, modelling of spill trajectory and fate were performed. This could be as a stochastic approach to cover variations in weather (winds/currents) within different seasons (see Canadian risk assessment south of 60th parallell) or for selected spill scenarios (most probable, worst case etc.) at risk hot-spots (see Area Risk Assessment in Canadian waters).
Links:
Risk Assessment for Marine Spills in Canadian Waters Phase 1: Oil Spills South of 60th ParallelArea Risk Assessment methodology for ship-source spills in Canadian waters.The environmental vulnerability of an area will scale the environmental consequence from a spill in terms of seriousness of impact towards different habitats, species or species groups, protected areas, socio-economic resources or human-use of an area. Most regional-scale risk assessments use some type of environmental vulnerability index, but different methods and criteria is in use with different data requirements to support the vulnerability assessment. Separate vulnerability scores are applied for species (birds, marine mammals, fish) and habitats (bottom, shoreline).
Use of Arctic Risk Influencing Factors
The Alaska marine oil spill risk assessment have included sea ice as a separate habitat type in the vulnerability assessment.
Assessment of Marine Oil Spill Risk and Environmental Vulnerability for the State of Alaska
For socio-economic features, Canada did some arctic adjustments to the Human-Use Resource index north of 60th, by including a coastal population index (see Risk Assessment in Canadian waters). In general, cultural features are more influenced by national prioritisations and seems harder to harmonise in an arctic context.
Risk Assessment for Marine Spills in Canadian Waters. Phase 2, Part B: Spills of Oil and Select HNS Transported as Bulk North of the 60th Parallel North.
As the arctic ecosystem are influenced by very dynamic and seasonal processes, a high temporal resolution in data seems necessary to capture the various possible outcomes in consequence of a spill in the arctic marine environment. This is relevant in order to capture the dynamics in areas of high biological productivity like the marginal ice zone, polar front areas or polynyas, but also with regards to abundance of species and the variation in spill vulnerability related to behavioural aspects and ecological use of areas for different purposes (spawning, nursery, migration, wintering, staging, moulting, breeding, feeding etc.).
The spatial resolution of data needed depends on the objective of the risk assessment and may span from AMSA IIc data of areas of heightened ecological significance (AMAP, CAFF, SDWG, 2014) down to very specific datasets like the Ecological Atlas of the Bering, Chukchi, and Beaufort Seas (Audubon, 2017). The latter represents a comprehensive and well documented dataset covering both the biological environment (fish, birds, mammals, primary productivity, ice phytoplankton concentration, zooplankton, benthic biomass) and the physical environment (ocean currents, sea ice, climate) at a monthly resolution.
A set of quality indicators of Arctic environmental datasets for the purpose of risk assessment are given below:
- There is a high resolution in time because of the dynamic character of theArctic ecosystem
- Areas of high biological productivity like the marginal ice zone, the polar front and polynyas are included
- Seafloor areas that are important feeding grounds for marine mammals are included
- Information about the species ecological use of an area is covered
- Species vulnerability evaluations towards oil spill and noise are presented
The endpoint in the environmental risk assessments combines the input from the spill risk with the environmental vulnerability and is typically expressed with relative consequence and risk categories.
Some relevant risk expressions are outlined below:
Risk = Oil modified Environmental Vulnerability x Incident rate x Spill Volume
Assessment of Marine Oil Spill Risk and Environmental Vulnerability for the State of Alaska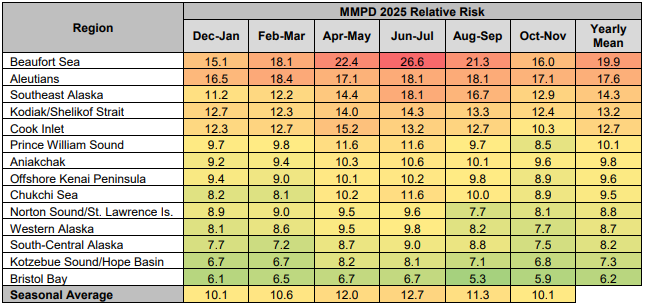
Environmental Risk index (ERI) = Frequency x Quantity x Env. Sensitivity Index pr. sub-sector
Risk Assessment for Marine Spills in Canadian Waters. Phase 2, Part B: Spills of Oil and Select HNS Transported as Bulk North of the 60th Parallel North.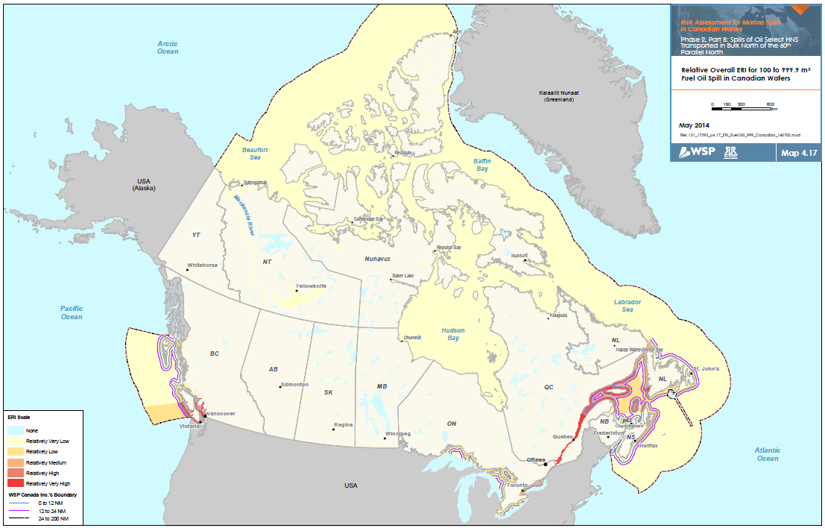
Risk Score = Frequency of exposure (FOE) x Consequence of exposure (COE)
Area Risk Assessment methodology for ship-source spills in Canadian waters.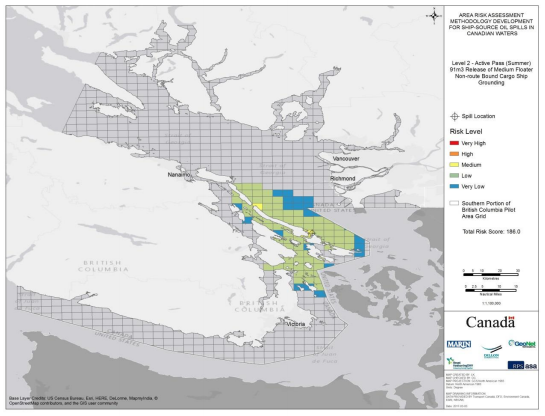
Environmental Risk = Probability for 6 environemntal consequence categories
Marine Environmental Risk Assessment Greenland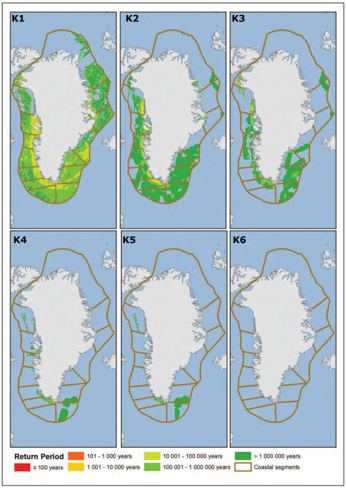
Risk of damage = Vulnerability x Average impact of oil (water column, sea surface)
Be-Aware Summary Report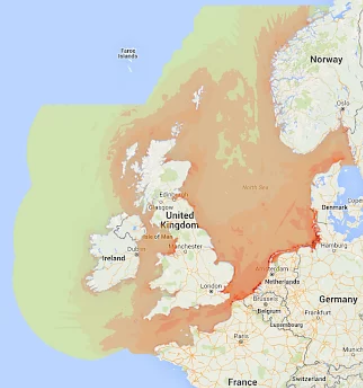
It seems beneficial to harmonize the consequence and risk categories to enable more comparable assessments.
Arctic Risk Influencing Factors

Ice
Ice
Ice may affect hull structure, stability characteristics, machinery systems, navigation, the outdoor working environment, maintenance and emergency, preparedness tasks and malfunction of safety equipment and systems.

Topside icing
Topside icing
Topside icing, with potential reduction of stability and equipment functionality.

Low temperature
Low temperature
Low temperature may affect the working environment and human performance, maintenance and emergency preparedness tasks, material properties and equipment efficiency, survival time and eperformance of safaety equipment and systems.

Extended periods of darkness or daylight
Extended periods of darkness or daylight
Extended periods of darkness or daylight as it may affect navigation and human performance.

High latitude
High latitude
High latitude, as it affects navigation systems, communication systems and the quality of ice imagery information.

Remoteness
Remoteness
Remoteness and possible lack of accurate and complete hydrographic data and information, reduced availability of navigational aids and seamarks with increased potential for groundings compounded by remoteness, limited , readily deployable SAR facilities, delays in emergency response and limited, communications capability, with the potential to affect incident response.

Lack of crew experience
Lack of crew experience
Potential lack of ship crew experience in polar operations, with potential for human error

Lack of emergency equipment
Lack of emergency equipment
Potential lack of suitable emergency response equipment, with the potential for limiting the effectiveness of mitigation measures.

Severe weather conditions
Severe weather conditions
Rapidly changing and severe weather conditions, with the potential for escalation of incidents.

The environment
The environment
The environment with respect to sensitivity to harmful substances and other environmental impacts and its need for longer restoration.
This is not a compliance tool. This guideline will not absolve the user of responsibility in the event of an accident. Disclaimer
This is not a compliance tool. This guideline will not absolve the user of responsibility in the event of an accident. Disclaimer

